I am looking over my students’ completed activity guides, and have a question specifically around the “US Women Running for Elected Office in 2020” dataset. I see many of my students have one woman running for Governor in DE on their screenshot, but when I look at the data in code.org myself, I do not see any for DE, but instead see one for PR. I noticed that the dataset has a total of 11 entries, but when I follow the link in the metadata to the source (Election 2020: Women Candidates for U.S. Congress, Statewide Elected Executive Office | CAWP), I see there are 13 (1 in DE, 2 in MO, 1 in MT, 1 in NC, 1 in ND, 1 in NH, 2 in PR, 1 in UT, 2 in VT, and 1 in WV). Can someone explain what’s going on
I’m also confused by the “Primary Date” column, some values are dates, others are “WON”, “Lost”, “Runoff”, or null
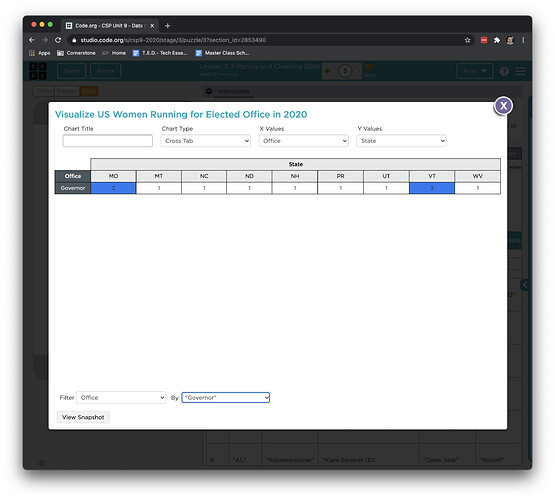
Using the Cross Tab Chart for the 2020 data, with Office for X value and State for Y value, I was able to filter for Office by Governor. The Chart showed 11 Governors. See chart below.
For your question about the Primary Date column, are you referring to the Primary column or the metadata source?
When I loaded the dataset today I didn’t see a Primary Date column. Perhaps it was removed recently.
Values for the Primary field are “W”, “NA”, “L”, and “WD”. Values for the General field are “Lost primary”, “L”, “TCTC”, and “W”. I think that anything other than Primary of “W” and General of “W” would mean that woman didn’t win the election.
When I filter on Governor I get 13 because I allow PR Governor. So 1 in DE and 2 in PR.
Unit 9 Lesson 3 does not yet introduce cross tabs to the students (that’s lesson 4), so they were using filtering on a bar chart. However, when I do the same chart as you, I get something completely different.
I think I am discovering part of my problem. I had tough an abbreviated version of this course earlier in the year, and had already viewed this dataset. When I looked at the version history, it showed that I had changes to the dataset (didn’t even realize I could change a dataset). When I reset my version, I’m now seeing data more in line with what others were seeing. However, where in the data for PR?
Ahh, I see that “PR Governor” is a different value than just “Governor”. Any reason why that is? Also, @jdonwells, was there an easy way to apply a filter to the data set provided in that lesson they way you provided in your screenshot, or did you need to create a separate dataset?
PR presumably means Puerto Rico which is not a state. So they may differentiate that.
Yes, I did create a second database and populated it like this:
readRecords("US Women Running for Elected Office in 2020", {}, gotRecords);

function gotRecords (records) {
  records.map(function (candidate) {
    if (candidate.Office.toLowerCase().includes("governor")) {
      delete candidate.id;
      createRecord("Governor",candidate,doNothing);
    }
  });
}

function doNothing () {}
This table is odd. What do the “Primary” and “General” fields mean? They seem to be talking about wins and losses, but for the first row, Primary = W and General = Lost Primary. Which is it? Can these columns be renamed so it is clear what they mean?
- Carol Ramsey
@carol.ramsey You can definitely rename them for your own data set. The option is available in the gear icon next to the column name.
As for the first row showing as Primary = W and General = Lost Primary, it is definitely misleading. When I explored further and looked at the original data set from Rutgers, this candidate was disqualified and so perhaps that is why they are labeled as “Lost Primary” in the General category. But, it would be better to label it as “Disqualified” than “Lost Primary”.
All of this would be great feedback for the curriculum writers. Let them know at support@code.org. 
Hi @carol.ramsey,
Thanks for asking about this dataset! You can find more information about this dataset and all the others by clicking on the “more info” button near the import button.
As for the row of data that @bhatnagars mentioned, this looks like a good case to talk about cleaning datasets. We have collected these datasets from the “wild” (this one comes from Rutgers University), and so sometimes the data isn’t fully standardized. Just as students learn at the beginning of this lesson, sometimes datasets need to be cleaned to make visualizations out of them.
Thanks again for bringing this up!
Cheers,
Ken


